Precision manufacturing relies on an unwavering commitment to measurement accuracy. When a design calls for tolerances of ±0.005 mm, the measuring equipment, operators, and methods must all work in concert. Yet many engineers and procurement professionals discover too late that their supplier’s measurement system is the silent source of non‑conformance. This is where the Gauge R&R study—and its companion, process capability analysis—become indispensable decision‑making tools.
At GreatLight Metal Tech Co., LTD., we have witnessed how a rigorous Gauge R&R study transforms quality management from reactive firefighting to predictive excellence. In this post, we unpack the principles, mathematics, and real‑world application of Gauge R&R studies, and then demonstrate how they feed directly into trustworthy process capability indices such as Cp and Cpk. Whether you outsource precision five‑axis machining or operate your own shop floor, this framework is the bedrock of dependable part production.
What Is a Gauge R&R Study?
Gauge R&R (Gauge Repeatability and Reproducibility) is a statistical experiment designed to quantify the variation present in a measurement system. The total observed variation in a manufacturing process—the spread you see in a control chart—is not just from the parts themselves. It is a composite of actual part‑to‑part variation and measurement system variation. The mission of a Gauge R&R study is to isolate the measurement component so that we can trust the data we are collecting.
Breaking Down the “R&R” Components
Repeatability – The variation observed when the same operator measures the same part multiple times with the same instrument under the same conditions. Think of it as the inherent precision of the gauge. If a micrometer gives a slightly different reading each time you close it on the same block, that difference is repeatability error.
Reproducibility – The variation when different operators measure the same part using the same instrument. Reproducibility captures differences in technique, training, and interpretation. Even seasoned inspectors can introduce subtle biases.
When you combine these two elements, you get the total measurement system variation. An ideal system contributes virtually zero to the total variation, freeing you to make confident decisions about whether a part conforms to specification.
Why a Gauge R&R Study Is Non‑Negotiable in Precision Machining
In high‑tolerance industries—medical hardware, automotive engine components, humanoid robot joints, and aerospace structural brackets—tolerances routinely fall in the micron range. A measurement system that itself consumes 30% or more of the tolerance band is already dangerously compromised. Many engineers have fallen into the “precision trap”: a supplier claims capability of ±0.001 mm, but the customer’s incoming inspection rejects batches. The root cause often lies not in the machine tool, but in an unverified measurement chain.
GreatLight Metal has systematically eliminated this black hole. Through our ISO 9001:2015‑certified quality framework and cross‑functional metrology lab, every critical measurement device—from CMMs to laser micrometers—undergoes scheduled R&R validation. This is not an optional extra; it is embedded in our production DNA.
How a Gauge R&R Study Is Performed
There are several accepted methodologies, but the two most common in discrete manufacturing are the Average and Range Method (often called the “Long AIAG method”) and ANOVA (Analysis of Variance). The choice depends largely on the software available and the complexity of the measurement scenario.
The Average and Range Method Step‑by‑Step
Select a representative sample of parts (typically 10) that spans the expected process variation. Include parts near the specification limits if possible.
Choose 2‑3 operators who routinely perform the measurement.
Randomize the measurement sequence to avoid systematic biases.
Each operator measures each part multiple times (commonly 2‑3 trials) in a blind fashion, i.e., the operator cannot see previous readings.
Calculate the range for each part/operator combination, then compute the average of these ranges ( R̿ ).
Determine repeatability (Equipment Variation, EV) using an appropriate constant (K1) based on the number of trials.
Determine reproducibility (Appraiser Variation, AV) from the range of operator averages.
Combine EV and AV to obtain Gauge R&R (GRR).
Compare GRR to the total variation (TV) or to the tolerance spread.
The rule‑of‑thumb criteria:
| %GR&R (based on TV) | Interpretation |
|---|---|
| < 10% | Measurement system is excellent and suitable for process control. |
| 10% – 30% | Conditionally acceptable; depends on application criticality, cost of measurement, and gage type. |
| > 30% | System requires improvement; measurements are not reliable for process decisions. |
A complementary metric is the number of distinct categories (ndc), which tells you how many statistically different groups the system can distinguish within the process spread. An ndc of 5 or more is generally desired.

The ANOVA Method
ANOVA is the more powerful, modern approach because it separates the interaction effect between operators and parts. Some measurement systems behave differently when Operator A measures a specific part versus Operator B. The Average and Range method can miss this interaction; ANOVA captures it explicitly. For precision CNC machining where surface finish, form error, or clamping can introduce operator‑part sensitivity, ANOVA is highly recommended.
GreatLight Metal employs Minitab and custom Python‑based statistical engines to perform full‑factorial ANOVA Gauge R&R on every coordinate measuring machine (CMM) program used for production qualification. This guarantees that the variation we report in a First Article Inspection (FAI) is true part variation, not measurement noise.
From Measurement Assurance to Process Capability
Once you have confidence in your measurement data, the next essential analysis is process capability—a set of statistical indices that compare the natural variation of a process to the specification limits. The most recognized indices are Cp and Cpk.
Cp: The Potential of Perfection
Cp assumes the process is perfectly centered between the specification limits. It is defined as:
Cp = (USL – LSL) / (6σ)
where USL = upper specification limit, LSL = lower specification limit, and σ is the short‑term process standard deviation (often estimated by R̅/d₂). A Cp of 1.0 means the 6σ span exactly equals the tolerance width; a Cp of 1.33 means the spread is only 75% of the tolerance, offering a comfortable margin.
Cpk: The Reality Check
Cpk accounts for where the process mean actually resides relative to the center. It is the minimum of two values:
Cpk = min[ (USL – μ) / (3σ) , (μ – LSL) / (3σ) ]
A high Cp but low Cpk signals that the process is inherently precise but off‑target. In precision machining, tool wear, thermal drift, and setup errors can all shift the mean over time. That is why GreatLight Metal monitors Cpk on every critical feature during serial production, using in‑line probing and statistical process control (SPC) software.
The Hidden Intertwining: How Gauge R&R Influences Capability Indices
The standard deviation σ you estimate from a sample of measurements is actually the total standard deviation σ_total, which already contains measurement error. So:

σ_total² = σ_process² + σ_measurement²
If your measurement system is noisy, σ_total is inflated, artificially depressing your Cp and Cpk values. You might conclude that your five‑axis machining center is incapable of holding a tolerance, when in fact it is the vernier caliper that is the culprit. Conversely, an overly optimistic measurement system can hide process instability, giving you a false sense of security.
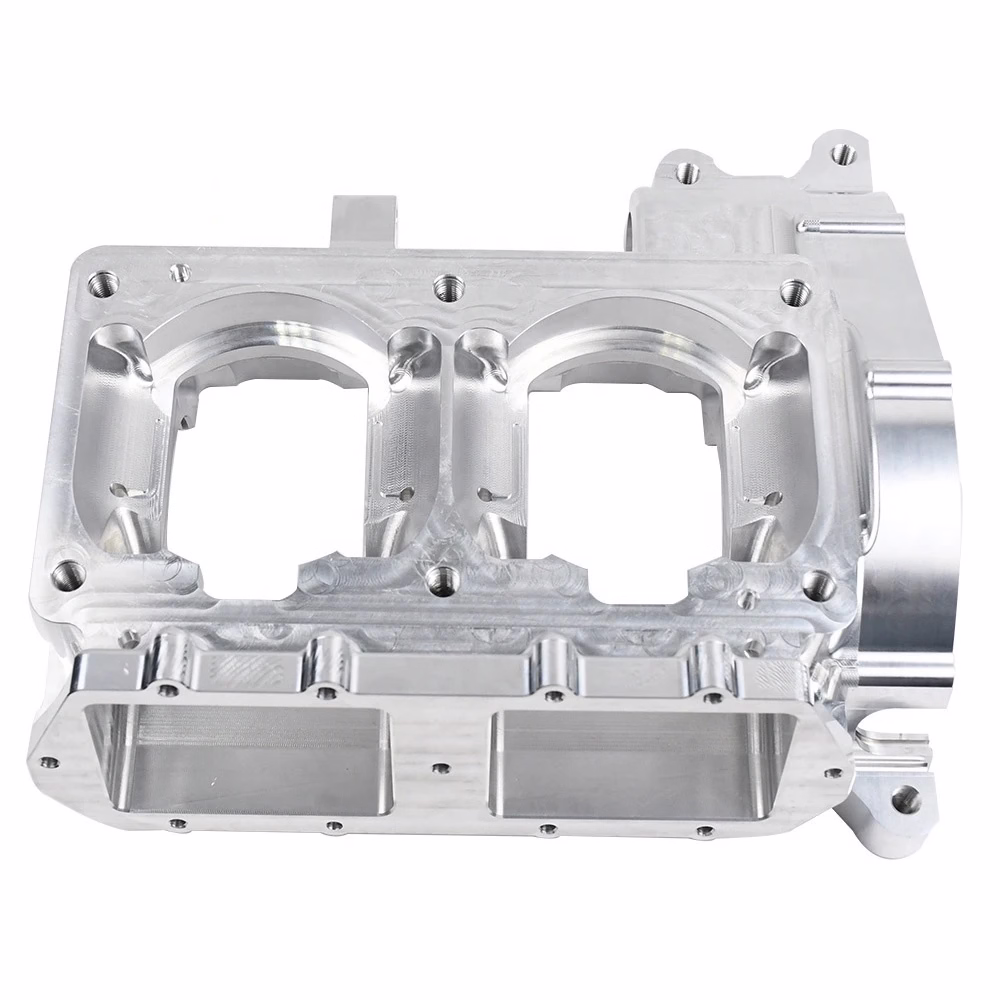
Consider a real‑world example from multi‑axis machining. A manufacturer measured the diameter of a 6 mm precision bore on an aluminum housing. The initial Cpk was 0.85 (below the 1.33 target). A Gauge R&R study revealed that the operator‑to‑operator reproducibility error alone accounted for 38% of the total variation. After standardizing the fixture, adding a digital CMM program, and retraining inspectors, the %GR&R dropped to 9%. The new Cpk soared to 1.52—simply because the true process capability was unmasked. This exemplifies the power of an end‑to‑end quality loop.
Practical Application: A Gauge R&R + Process Capability Integration Framework
To embed this thinking into your supplier selection and internal audits, adopt a framework we use when onboarding complex projects at GreatLight Metal:
Step 1 – Define the Measurement Task
Identify every characteristic to be measured (tolerances, datums, surface finish). Classify them as critical to quality (CTQ) and non‑CTQ. For CTQ features, a formal R&R study is mandatory.
Step 2 – Pre‑Qualify the Measurement System
Run a full ANOVA Gauge R&R with at least 10 parts, 3 operators, and 3 trials. The acceptable threshold we enforce internally is %GR&R ≤ 10% of the feature tolerance, not just the process spread. This is a stricter criterion because it directly relates measurement error to the pass/fail decision.
Step 3 – Establish Baseline Process Capability
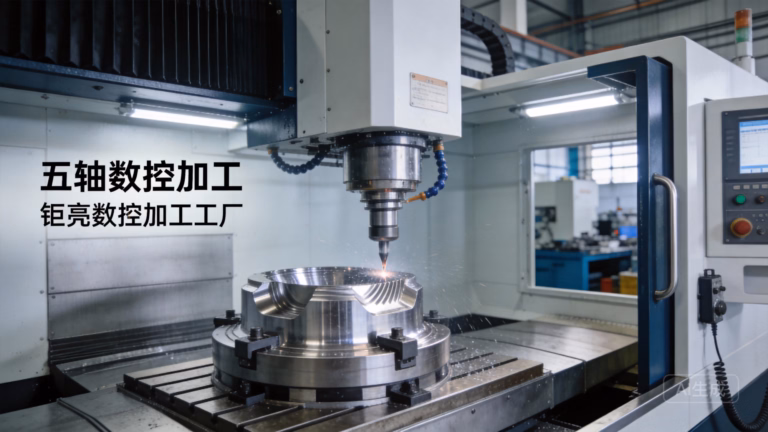
With a validated measurement system, produce a short‑run capability study (typically 30‑50 pieces) to compute initial Cp and Cpk. At GreatLight Metal, our advanced precision 5‑axis CNC machining services routinely deliver initial Cpk values above 1.33 for tight‑tolerance surgical robot arms and EV powertrain components.
Step 4 – Ongoing Monitoring via SPC
Once mass production begins, we transition to X‑bar & R or I‑MR charts, with periodic repeat Gauge R&R studies (every 6 months or after any fixture change). If a trend or shift is detected, we re‑evaluate the measurement system first before adjusting the machine. This philosophy has saved countless hours of unnecessary corrective action.
Common Pitfalls and How GreatLight Metal Overcomes Them
Pitfall 1: Using the Wrong Parts for the R&R Study.
If you select parts that do not reflect the full process spread, the study will yield overly optimistic GR&R percentages. We ensure that the sample covers 80‑100% of the tolerance range, sometimes deliberately including borderline parts.
Pitfall 2: Ignoring Within‑Part Variation.
For form tolerances like cylindricity or flatness, a single number per part may miss the measurement error arising from different probing paths. Our CMM programs automatically take multiple points and filter with Gaussian regression, and the GR&R study is performed on the resulting form characteristic, not just a diameter.
Pitfall 3: Treating Gauge R&R as a One‑Time Event.
Fixtures loosen, CMM styli wear, and environmental conditions change. We link every device to a calibration schedule and redo R&R whenever a probe is changed or after annual maintenance.
Pitfall 4: Overlooking Data Security and Compliance.
For clients in medical and automotive sectors, measurement data integrity is as vital as the part dimensions themselves. GreatLight Metal’s ISO 27001‑compliant data management ensures that all R&R and capability records are securely stored, traceable, and available for audits per IATF 16949 and ISO 13485 requirements.
Tools of the Trade: From Spreadsheets to AI‑Enhanced Analysis
While a simple Microsoft Excel template can perform the Average and Range method, the complexity of modern manufacturing justifies more sophisticated tools. We extensively use:
Minitab for classical GR&R and capability six‑pack reports.
Python (NumPy, SciPy, statsmodels) for custom ANOVA and variance component estimation when non‑standard sampling plans are required.
Zeiss PiWeb and Renishaw Productivity+ for closed‑loop integration between the CMM, the machine tool, and the quality database.
For many of our customers, especially startups developing electromechanical devices, we provide a complete capability portfolio report that narrates the journey from Gauge R&R to sustained Cpk > 2.0. This transparent approach is why they choose GreatLight CNC Machining as a long‑term partner, knowing that the dimensional data they receive is not just numbers but truth.
Comparison: Where GreatLight Metal Stands Among Industry Peers
When evaluating precision machining vendors, look beyond glossy sales decks to their actual measurement philosophy. Several tier‑one suppliers offer competent machining, but how they handle Gauge R&R varies dramatically:
GreatLight Metal – Internal metrology lab; full ANOVA GR&R for every CTQ project; on‑site SPC integration; ISO 9001, IATF 16949, and ISO 13485 certified.
Protocase – Strong on rapid sheet metal, but relies primarily on standard calibration rather than continuous GR&R for complex machined parts.
Xometry – A vast network with varying quality levels; R&R may depend on the individual partner’s discipline.
RapidDirect – Competitive for low‑volume machining, though deep process capability reporting is often an add‑on.
Owens Industries – High‑end multi‑axis work with solid metrology, but typically serves larger aerospace OEMs.
GreatLight Metal occupies a unique sweet spot: industrial‑grade metrology rigor accessible to both innovative startups and established automotive Tier 1s, all from a single 76,000‑sq.ft. campus in Dongguan.
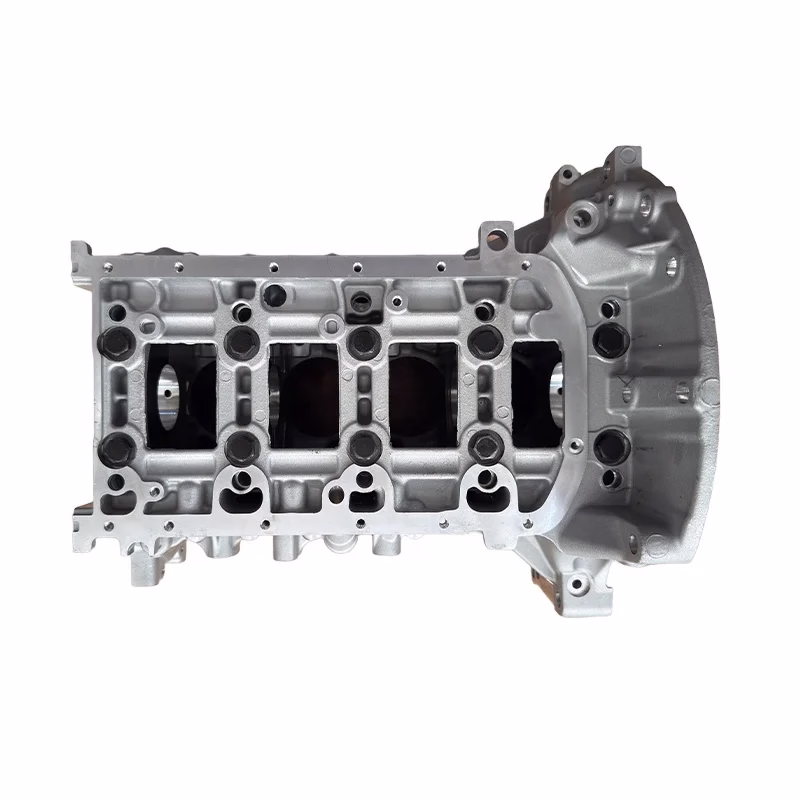
Real‑Life Impact: Case in Engine Component Manufacturing
A client designing a next‑generation fuel injection manifold required a bore concentricity of 0.010 mm. Initial capability studies at another supplier gave a Cpk of 0.92, attributed to machine limitations. Upon transferring the project to GreatLight Metal, our first action was a detailed Gauge R&R study. We discovered that the previous supplier had used a mechanical two‑point bore gauge, which, under operator influence, had a %GR&R of 34% relative to the tolerance. We deployed a scanning CMM probe with automated path planning and achieved a %GR&R of 7%. The resulting process capability jumped to Cpk 1.47 without any change to the machine tool—simply by restoring measurement fidelity. The client saved months of redesign and capital expenditure.
Beyond the Basics: Attribute Gauge R&R and Destructive Testing
Not all measurements are on a continuous scale. In threaded parts, for instance, go/no‑go gages are common. An attribute Gauge R&R evaluates repeatability and reproducibility of pass/fail decisions. We perform these for visual inspection criteria, thread acceptance, and presence/absence checks. The metric is the kappa statistic, aiming for a value above 0.75 (substantial agreement). When destructive testing is necessary (e.g., tensile tests on castings), a nested GR&R design is employed, acknowledging that the same part cannot be measured twice.
GreatLight Metal’s die‑casting and 3D printing (SLM/SLA/SLS) groups regularly apply these specialized R&R forms to guarantee that even non‑traditional measurements are statistically sound.
Building a Culture of Measurement Integrity
Technology alone cannot deliver a robust measurement system; it must be coupled with a culture that values data integrity. At GreatLight Metal, we conduct quarterly GR&R refresher training for all quality and production personnel. Operators understand that their technique directly influences the factory’s ability to detect tool wear and avoid expensive rework. This human factor is often the missing link in a purely tool‑centric approach.
Furthermore, our commitment to full‑process traceability means that from the moment raw material enters our Chang’an facility to the final surface finishing and CMM report, every measurement point is logged against a specific operator, instrument, and time stamp. In the event of an audit, we can instantly pull the GR&R record associated with the instrument that issued a contested measurement.
The Way Forward: Continuous Improvement Through Data
As manufacturing moves toward Industry 4.0 and digital twins, the integrity of measurement data becomes even more critical. Machine learning algorithms that predict tool life depend on accurate dimensional feedback. A single erroneous data point—unchecked by a Gauge R&R study—can skew the model and cause systematic failures.
That is why Gauge R&R is not an isolated quality exercise; it is the foundation of smart manufacturing. GreatLight Metal has already integrated real‑time measurement variability monitoring into its production IT architecture. When the system detects a degradation in repeatability (perhaps a dirty probe), it alerts the quality team and locks out the instrument until a service and re‑verification are performed. This proactive stance prevents bad data from ever reaching a decision maker.
For engineers and purchasing managers, the take‑away is clear: before you commit to a high‑precision CNC machining partner, interrogate their measurement system analysis discipline. Ask to see a recent GR&R study for a tolerance analogous to your own. If they cannot produce one within 24 hours, consider it a warning flag. Among suppliers, those who marry advanced five‑axis machining with Six‑Sigma‑level metrology—like GreatLight Metal—stand apart.
Conclusion: Your Data’s Veracity Defines Your Product’s Destiny
Gauge R&R studies and process capability analysis are more than academic jargon; they are the practical insurance that your parts will function, assemble, and endure as intended. In a landscape where many claim precision but few verify it, the methodology you adopt for measurement validation directly correlates with your product’s field reliability. The subtle interplay between repeatability, reproducibility, and true process spread determines whether your quality escape risk is one in ten thousand or one in a million.
At GreatLight Metal Tech Co., LTD., our decade‑long journey from a local mold shop to an internationally certified precision powerhouse has been underwritten by a simple principle: never trust a number without knowing the measurement uncertainty behind it. We invite you to hold your supply chain to the same standard. When you combine state‑of‑the‑art five‑axis machining with a measurement system that yields ndc > 10 and %GR&R in single digits, you unlock a level of process capability that transforms a drawing into a masterpiece of engineering.